Urban Transportation Policy
Professor Hirohide Konami (Ph.D.)
Faculty of International Studies, Tokyo Jogakkan University
(81) 42-796-9231 hiro@konamike.net http://konamike.net/hiro/
(This paper is the note of JICA Group Training Course in Tokyo: Comprehensive Urban Planning)
1 Urban Transportation in Japan
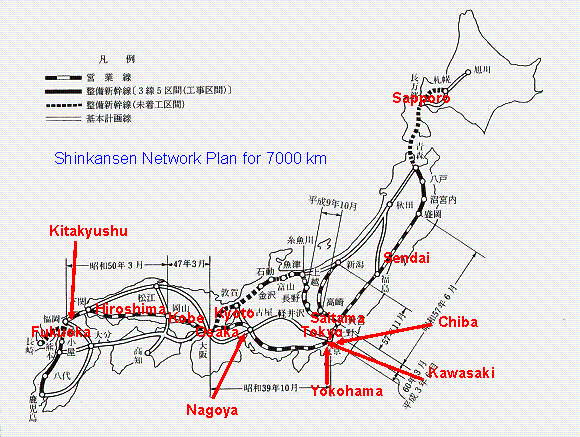
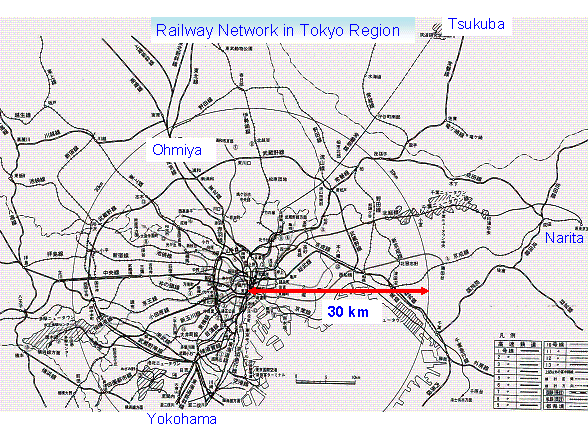
Urban transportation differs from big cities to small towns. Railway system plays the dominant role in big cities such as Tokyo, Yokohama, Nagoya and Osaka. These cities have the population of more than 2 million. Kawasaki City is located between Tokyo and Yokohama and enjoys the good service of railway system in the middle. Chiba and Saitama cities are located 30km east and 30km north of central Tokyo respectively and have no subway system yet. Chiba city has a monorail system. In this Tokyo Metropolitan Region, it can be said in general that a railway station should be located for each 20 to 30 thousand population and a railway line for about one million populations each. Total regional population is about 30 million. About 90% of commuters to down town Tokyo choose railway system for their daily commuting.
The second biggest metropolitan area is Osaka region and has the population of about 20 million. Kyoto and Kobe cities are located 40km northeast and 30km west of Osaka Station respectively. Almost every railway system in this region is connected to Osaka down town area except 2 subway lines in Kyoto city. This region’s modal choice pattern and the density of railway system are very similar to that of Tokyo region.
The third biggest metropolitan area is Nagoya region and has the population of about 10 million. Nagoya city has constructed 5 subway lines but not enough. Therefore, bus system is playing an important role in this region. The commuters in this region depend on automobile more than Tokyo and Osaka regions.
Table 1 Outline of Big Cities
| Name of Big Cities | Population (Thousand) | Number of SubwaysIn 2006 | Number of Monorailand Light Rail 1n 2006 | |
| 1995 | 2006 | |||
| Sapporo | 1,752 | 1,887 | 3 | 0 |
| Sendai | 970 | 1,026 | 1 | 0 |
| Saitama | 968 | 1,191 | 0 | 0 |
| Chiba | 856 | 928 | 0 | 2 |
| Tokyo (23 Wards) | 7,935 | 8,524 | 12 | 3 |
| Kawasaki | 1,202 | 1,340 | 0 | 0 |
| Yokohama | 3,303 | 3,598 | 2 | 1 |
| Nagoya | 2,144 | 2,220 | 5 | 1* |
| Kyoto | 1,454 | 1,473 | 2 | 0 |
| Osaka | 2,602 | 2,634 | 7 | 0 |
| Kobe | 1,422 | 1,528 | 2 | 1 |
| Hiroshima | 1,107 | 1,156 | 0 | 1 |
| Kitakyushu | 1,019 | 990 | 0 | 1 |
| Fukuoka | 1,280 | 1,411 | 3 | 0 |
* Dual mode bus
The other big cities such as Sapporo, Sendai, Hiroshima, Kitakyushu and Fukuoka do not have enough railway system. Sapporo has 2 subway lines, Sendai has 1 subway, Hiroshima has 1 monorail, Kitakyushu has 1 monorail and Fukuoka has 3 subway lines. The comparison of transportation mode in three metropolitan areas is shown in Table 2. This is calculated based on the person trip survey and showing the share of transportation mode among railway, bus and streetcar, and automobile. Then the trips made by 2 wheel vehicles and walking are excluded. The share of 2 wheel vehicles and walking in total trips is about half.
Table 2 Transportation Mode in Metropolitan Areas
| Metropolitan Area | Year | Railway% | Bus & Streetcar% | Automobile% |
| Tokyo | 1998 | 42 | 4 | 54 |
| Osaka | 1990 | 40 | 7 | 53 |
| Nagoya | 1991 | 32 | 6 | 62 |
There is a tendency that the usage of automobile increases and the share of 2 wheel vehicles and walking decreases when the size of metropolitan area becomes smaller. For example, in Maebashi and Takasaki Region with the population size of about half a million, the share of 2 wheel vehicles and walking is about one third and the share of automobile among railway, bus and streetcar, and automobile rises to 94% in 1993.
2 Hot Issues on Comprehensive Urban Transportation Policy
(1) Present Situation of Urban Transportation
Commuters
Commuters are facing heavy road and railway congestion in big cities and the lack of modal choice in small cities. It would be a shame that Japan has still “Shirioshiya (pusher men)” in several railway terminals. In rural, “Daikou Untenshu (replacing driver when a driver is drunk)” is popular in down town. They consist of a couple drivers and one driver drives the drinker’s automobile home and another follows by a small car by almost the same fare as taxi.
It is also a common seen in Japan to find a mass of bicycles at every railway station in big cities. This is caused by the lack of the space of bicycle parking. First of all, nobody could imagine such heavy usage of bicycles in the city. Even they know that walking is better for their health, they prefer bicycles to go to the railway stations. The reason would be of course the shortage of time in the morning caused by the overslept or idleness. People do not like to walk if it is over 500 or 1000 meters. It is reasonable for ladies that they feel safer when they return home in dark by bicycle than by walking. As a result the bicycles are illegally piled up in front of every railway station, and some of them are stolen or abandoned by the municipalities. Though a bicycle costs 2,000 to 3,000 yen in second hand and 10,000 to 20,000 yen for new one, people don’t care the cost in these days.
Shopping
Every down town is facing the decreasing tendency of shoppers and visitors. The re-activation of down town is the top issue in all cities and towns in Japan. This was caused partially by the modal shift from railway to automobile and largely by the traditional management of shops and restaurants in down town. Modern shopping centers in suburbs with enough space for car parking can absorb weekend customers and young people. Moreover, the shops and restaurants in suburban shopping centers have succeeded to cut down the management cost and offer better prices.
Business
A punctual person prefers subway to automobile in Tokyo and Osaka regions. If you are lucky enough, you can drive 5 km by 10 minutes, but if you are involved in traffic jam, it will take 1 hour. This was caused not only by the lack of traffic capacity but also by the construction boom of office buildings in down town. This boom also caused the relocation of houses from down town to suburbs and promoted the increase of number of long distance commuters.
Recreation
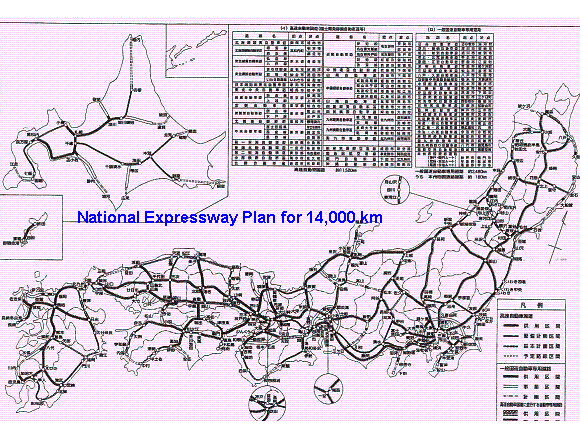
Big traffic jam in weekends and holiday seasons along national expressways are too much common in these days in Tokyo and Osaka regions. For example, traffic jams over 50 km long along the national expressways are usual in Tokyo region in the beginning of May, middle August and New Year season and it is usual to take a double or triple time from suburban golf links to down town home in every weekend. There are 21 express traffic lanes outwards in Tokyo, but not enough to manage such recreation trips of 30 million residents.
Freight
Rising cost and unpunctuality caused by traffic jam are big issues in big cities. According to the freight movement survey in 3 big metropolitan areas, the average freight movement per day and per resident is 110 to 148 kg in these 30 years. Modal share is about 80-90% by automobile, 1-5% by train and 5-15% by ship. It is said that the freight movement survey is more difficult than the person trip survey, because the freight itself keeps silence and freight check is not always reliable.
Others
The other hot issues are environmental problems, traffic accidents, transportation for aged and unable people, and transportation demand management. About 10 thousand people die by traffic accidents every year in Japan.
(2) Comprehensive Transportation Planning
Person trip survey
In order to complete a comprehensive transportation planning, it is inevitable to carry out a person trip survey. This will reveal the daily activity of each person such as number of trips, trip purpose, transportation mode, origin and destination, transfer point, departed and arrived time, payment and a face sheet (age, profession, gender, family size, income, address, place of work, car ownership and others).
Freight Movement Survey or Commodity Flow Survey
Freight movement and person trip survey are the basic data for comprehensive transportation planning. Both are the essential for modal split analysis.
Freight movement survey is conducted through manufacturers, wholesalers, retailers, offices, other establishments and transportation companies. The data of transportation companies gives us the image of actual amount of movement and is compared with the data from the order form of establishments. Establishments will not necessarily order to transportation companies to move their commodities and transport by themselves by their own cars or trucks. On the other hand, transportation companies have their own transportation network and sometimes the record of transportation is overlapped when the commodities are collected and transported as a pack. Furthermore, the weight of commodities is not reliable. The person who fills up the order form is sometimes not interested in the weight but the value. In other case, the weight of casing is much heavier than the commodity itself and the record is written only based on the content.
By many reasons, the accuracy of commodity flow survey is very low and we will face the difficulties of adjustment. Even though it is useful to get the image of daily movements of commodities.
Automobile OD Survey
This survey is very common and requests automobile owners and transportation companies to keep their record of movements of their cars in a day. We will get the data on places of origin and destination, trip purpose, type and size of the car, trip length, trip route, departure and arrival time, trip cost, number of passengers, weight of commodities, and face sheets. This information is only about automobiles and not enough for the comprehensive transportation planning but useful to raise the total reliability.
The Other Transportation Data
Transportation data of railway companies, shipping companies, airlines and road traffic counters are useful to get the total amount of movement and raise the accuracy. These data are also used to analyze the future tendency.
Research Technique
The estimation technique of traffic generation, traffic distribution, modal choice and route assignment is the fundamentals for the comprehensive transportation planning. For this purpose it is necessary to analyze the relation between urban activities and traffic, the relation between traffic and tele-communication, the relation between income level and car ownership, the relation between car ownership and modal choice, and so on.
Environmental Impact
Every transportation facility has some environmental impact. Then it is requested to carry out the environmental impact studies on noise, exhaust gas, vibration, botanies and animals. In these days, it may be also requested to examine the landscape and efficiency of energy consumption.
Transportation Economy
Transportation economy is one of the most important factors of comprehensive transportation planning. It is of course important to evaluate not only the money factor but also the value of comfortableness, reliability and safety.
Transportation Policy
Fare collection, service level, role of public and private, source of investment money and investment timing are the problems of transportation policy.
(3) Strategies for Urban Transportation
Followings are the examples of hot issues on urban transportation.
(1) Construction of subways and expressways
http://www.tokyometro.jp/e/index.html
(2) Introduction of TDM (Transportation Demand Management) in metropolitan areas
http://www.mlit.go.jp/road/road_e/contents.html
(3) Elevation of railways and “through operation” of commuter’s train
(4) Introduction of low-floor and hybrid engine busses
(5) Consideration of road pricing
http://www.vtpi.org/tdm/tdm35.htm
(6) Recommendation of off-peak commuting, satellite office and home office
http://konamike.net/hiro/papers/Paris2001.htm
(7) Revival of streetcars and LRT
(8) Introduction of zone system and transit mall
(9) Construction of parking space in down town
(10) Introduction of the parking space certification for each car registration
(11) Strict car inspection for gas exhaustion


